How is LiDAR Data Used to Protect Water Quality in Minnesota?
 High resolution elevation data
collected using LiDAR technology has been available
for parts of Minnesota for several years, much of it made possible by funding
from the
Clean Water Fund of the
Clean Water, Land and Legacy
Amendment. The following examples
illustrate how LiDAR data is already being used to protect water quality in
Minnesota. As this data becomes available for more areas of the state, the
uses are expected to increase exponentially. Click on any graphic to
see it full-size.
- Erosion analysis
- Water storage to reduce streambank erosion and improve water quality
- Siting and design of best management practices
- Wetland mapping, protection, and restoration
- Flood control and mapping
Erosion Analysis
Estimating Soil Erosion Using LiDAR-derived Terrain Attributes and 137Cs
Concentrations in Soils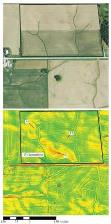
137Cs is a radioactive isotope whose only source is nuclear fission. The isotope bonds strongly to soils and “labeled” the soil surface during aboveground nuclear testing in the 1950s and 1960s. Measuring the 137Cs content of soil profiles serves as an effective tracer for soil movement on decadal scales. The picture is an example output from a regression model developed by researchers at the University of Minnesota. Based on digital terrain attributes, the model result shows localized areas of potentially high erosion rates while the overall average field erosion rate is 3 tons/acre/year. When applied to cultivated landscapes, the regression models create maps of predicted long-term rates of soil erosion or deposition. These maps will be useful to Board of Water and Soil Resources personnel, soil conservationists, and other local government unit personnel to help identify which portions of the landscape would benefit the most from perennial vegetation conservation practices.
- Modeling Soil Erosion with 137Cs: Final report for this LCCMR-funded project
- Soil erosion data:
- Download by county in raster file geodatabase format
- See Appendix A in the final report above for help using the data to compute field-average
erosion/deposition rates
Predicting Locations of Concentrated Water Flows and of Field Gully Erosion
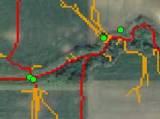 In
the Seven Mile Creek watershed in Nicollet County, LiDAR data was used to reduce
time and labor to find likely sites of gully erosion. A terrain model
and water routing computer program predicted where water would flow across
fields; the points at which these flows entered a ditch or stream were the most
likely locations for gullies to form. Field
inspection verified that the model accurately predicted where gullies were
forming. The map to the left shows the water flows as orange and red lines
(red lines are higher flows); sites of field-verified gully erosion are shown as
green dots.
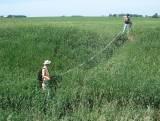 Performing
an on-the-ground inspection to locate and map gullies in the same small
watershed required $10,000 in labor and other costs. Scaling up ground
inspections to the size of Nicollet County would cost more than $100,000 and to
the size of the Minnesota River Basin, $4 million. On-the-ground work at that
scale would require several years to accomplish with available trained
personnel. High resolution topographic data with the terrain models would
eliminate much of the reconnaissance work and re-focus valuable personnel field
time on designing and installing targeted solutions to reduce or prevent erosion.
Analyzing Erosion and Sediment Accumulations
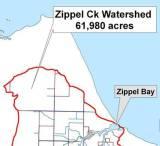 The
Natural Resources Conservation Service is analyzing sediment accumulations in
Four Mile Bay and Zippel Bay in the Bostic and Zippel Creek watersheds in Lake of the
Woods County. Increasing amounts of sediment are degrading fish habitat
and increasing dredging costs in the bays. Specific goals of the project include:
- Identifying major sources of sediment within these watersheds
- Quantifying the sedimentation damages (monetary and environmental)
- Identifying the causes of ditch systems’ instabilities and erosion
- Using landowner input, identify potential conservation practices for reducing sediment loads and sediment movement within the watersheds
NRCS is using LiDAR to help identify ephemeral erosion sites and to produce slope estimates to use in computing the amount of erosion (determined using the Revised Universal Soil Loss Equation, or RUSLE). LiDAR will also be used in the hydrology/hydraulics model which in turn will be used to estimate potential streambank erosion sites.
Water Storage to Reduce Streambank Erosion and Improve Water Quality
Finding Depressional Areas for Potential Water Storage to Reduce Runoff, Flooding, and Sediment
Loads
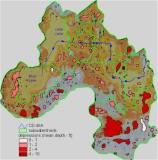 High
resolution topography can be used to very accurately identify the size, depth
and location of depressions in the landscape. The graphic shows depressional
areas where water could be stored in the area drained by Nicollet
County Ditch 46A, within the Sevenmile Creek watershed, which drains directly
into the Minnesota River. Using the depression information, hydrologic modeling
can then be done to identify
specific locations within a watershed for temporarily storing runoff to
achieve the greatest reduction in peak flows. Reducing peak flows from
this watershed will decrease the amount of sediment and nutrients delivered to
the Minnesota River.
Creating a Water Storage and Treatment Plan for Ditch 57 Watershed
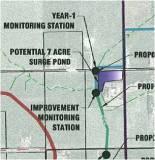 In
Blue Earth County, I&S Group is designing a water storage and treatment plan
associated with an agricultural improvement project in the 6000 acre (9 square
mile) County Ditch 57 watershed. Using LiDAR data provided
by Blue Earth County they saved:
- $10,000 in surveying and other investigations for completing the detailed hydrologic design model for the watershed
- $5,000 in pinpointing areas early in preliminary design to locate potential storage/treatment areas and rule out other areas that would not be cost-effective
- $5,000 in preliminary cost estimating and preliminary designs for determining improvement options for replacing the outdated agricultural drainage system
- $3,000 in preliminary cost estimating for calculating earthwork quantities for alternatives that needed to be considered after the landowners that owned the original pinpointed areas did not want storage on their properties
This is for one project in a 9 square mile watershed. The Minnesota
River Basin includes 15,000 square miles in Minnesota. Scaling up savings
of this magnitude equals $38 million in potential savings if similar projects
were completed throughout the watershed.
Siting and Design of Best Management Practices
Siting a Manure Storage Facility to Avoid Winter Application
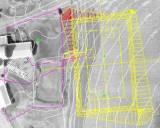 The Stearns County Soil
and Water Conservation District used LiDAR-derived elevation data to speed the
siting and design of a manure storage facility. Such facilities protect
water quality by allowing farmers to avoid winter application of manure which
can be washed away in spring run-off. The topographic data allowed staff to quickly
assess the entire project area to select preliminary sites; on-the-ground
surveying was then targeted to these sites. Once the final site was
selected, staff compared cut-and-fill estimates obtained using the computer
model with those obtained using on-site surveying; the figures were remarkably
similar, within 3-7 percent.
Prioritizing Restoration and Protection Projects, and Targeting Best Management Practices
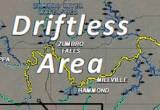
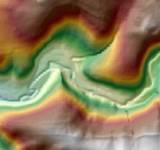 A
proposal to comprehensively identify
and rank critical sources of erosion and runoff in
the Zumbro Watershed has been recommended for funding by the Legislative-Citizen
Commission on Minnesota Resources (LCCMR). The project would use LiDAR and
other GIS data and precision conservation tools to prioritize restoration and
protection projects with the highest cost-benefit.
Once the top 50 source locations were identified, staff would develop and use an in-field assessment technique to further evaluate and plan best management practices appropriate for those locations. LiDAR will assist in defining critical runoff areas, and guide the placement of BMPs including terraces, sediment and water control structures, grassed waterways, and grassed buffers.
Click on either graphic to see a map of the whole
watershed.
Wetland Mapping, Protection, and Restoration
Creating a Wetland Probability Map
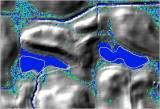 As
part of an on-going project to update Minnesota's National Wetland Inventory (NWI) data, a pilot study was conducted to develop a wetland probability map
for the Knowles Creek Watershed in Rice County, Minnesota. Using terrain
variables derived from LiDAR and soils data, two models were developed to create
continuous wetland probability maps for the study area. The graphic to the left
compares original NWI wetland boundaries (white lines) with
the output from one of the models (blue-green colors). Blue areas have the
highest probability of being wetlands; green areas have a lower probability.
The background is a hillshade created from LiDAR data.
Compared with traditional wetland maps that show a sharp boundary around each wetland, wetland probability maps may better represent:
- Boundary uncertainty and transition zones
- Hydrologic connectivity and function
- Wetland restoration opportunities
- Drier-end water regimes
Flood Control and Mapping
Identifying Flood Control Impoundment Sites to Reduce Runoff
Overall Project: In the Wild Rice Watershed District of the Red River Basin, Houston Engineering estimated that they saved $75,000 by using LiDAR data to examine 25 candidate sites for water storage. The total area examined was 15.6 square miles, and would have cost $5,000 per square mile for 25-ft grid spacing of points with a GPS on an ATV. This is in addition to the value of the LiDAR data they used to scan the whole 210 square miles of the district to identify those 25 candidate sites, data for which there are no feasible substitutes in relatively flat landscapes. Other significant cost savings from LiDAR data for the following components of the same project were:
- conceptual alternative site screening
- hydrologic modeling (drainage basin delineation)
- hydraulic modeling (extension of river cross-sections)
- wetland impact determination (identifying boundaries)
- wetland mitigation site planning (where at, how large would it be?)
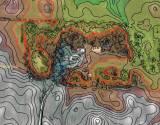
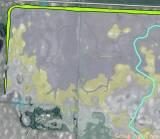 Example
Impoundment Site: To design an impoundment site in an area along
Clay County Ditch 18, accurate topographic data was essential to avoid flooding
a farmstead. The graphic to the left uses red lines to show the elevation contours around
the farmstead at 1,192-feet, the proposed level of the top of the dam. The
analysis confirmed that much of the property would be flooded at that
level. The graphic to the right illustrates the lands flooded at different
water levels; in the final plan, an emergency spillway ensures a maximum level
of 1189 which will not flood the farmstead.
Designing a Ring Dike
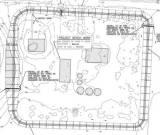
 Houston
Engineering used LiDAR elevation data when designing a ring dike to protect a
farmstead from flooding in the Wild Rice Watershed. High-resolution
topographic data was needed to accurately locate, size and align the structure,
to estimate material quantities and total costs, and to meet permitting and
mitigation requirements.
Mapping Inundation Areas
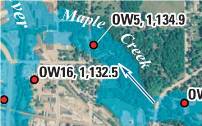 LiDAR-based
flood-peak inundation maps and water-surface profiles were created for the U.S. Geological Survey report,
Floods of
September 2010 in Southern Minnesota. The maps and profiles were
constructed using GIS by combining high-water-mark data with the highest
resolution digital elevation model data available. The flood maps and
profiles show the extent and height of flooding through the most severely
affected communities.
These maps are used by Federal, State, and local agencies to make informed decisions in meeting mission requirements related to flood hazard mitigation, planning, and response. For example, the Federal Emergency Management Agency (FEMA), Minnesota Department of Natural Resources, Minnesota Department of Public Safety, and Minnesota Homeland Security and Emergency Management need timely information on the magnitudes and frequency of floods to help respond to flood damage, enhance emergency response management, protect infrastructure, provide recovery guidance from the National Flood Insurance Program and State regulatory programs, and plan for future flood events.
Return to MnGeo's first-stop Elevation information page

